Another old posting from my previous blog.
Continuing to get acquainted with Python, I looked at the book „Introduction to Data Science“ by Joel Grus. I have it in German as an electronic book, which is unfortunately no fun to read, although the content is solid – with restrictions. The most important problem is the formatting of the Python code, which does not even work in landscape mode. The printed book uses a smaller font and lines are completely in one line. You can and should download the examples. There are also some misprints. I found one in the introduction to the Bayes formula, where the fraction is reversed. But most importantly, I have my doubts if the book is really a help for the starting data scientist. The presentation is very short. You will need a good background in math and programming, or have someone to ask if you do not understand the theory or the code. The code gets pretty advance pretty fast.
However, this is not a review of the book. But I take an example of the book to show how Python can be used from within Euler Math Toolbox. The following code reads the bible and prints the 10 most common words.
infile = open("bible.txt","r")

from collections import Counter

num_words = 10

counter = Counter(word.lower()
    for line in infile
    for word in line.strip().split()
    if word)

for word, count in counter.most_common(num_words):
    print(str(count)+"\t"+word)

infile.close()
I downloaded the file „bible.txt“ from the net and put it into the folder, where the IPython notebook resides. The output is the following.
64183	the
51379	and
34746	of
13643	to
12799	that
12559	in
10263	he
9840	shall
8987	unto
8835	for
Now, let us do this programming exercise in Euler Math Toolbox via Python.
>>> from collections import Counter
>function python testbible (filename) ...
$""" 10 most common words in the bible
$"""
$infile = open(filename,"r")
$num_words = 10
$counter = Counter(word.lower()
$    for line in infile
$    for word in line.strip().split()
$    if word)
$res = ""
$for word, count in counter.most_common(num_words):
$    res = res+str(count)+"\t"+word+"\n"
$infile.close()
$return res
$endfunction
>testbible("bible.txt")
 64183   the
 51379   and
 34746   of
 13643   to
 12799   that
 12559   in
 10263   he
 9840    shall
 8987    unto
 8835    for

>>> help(testbible)
 Help on function testbible in module __main__:

 testbible(filename)
     10 most common words in the bible
The import was done with a direct Python command. The function returns a string with the answer. But it could just as well use „eumat.dump(„….“)“ for a direct output. Note, that you do not need to indent the Python definition. That is done automatically by EMT.
The „$“-signs in the function definition allow copying and pasting the code into an EMT notebook. They are not visible in the EMT window.
Here is another example, done in IPython.
def sieve(N):
    v = [True for _ in range(N+1)]
    for k in range(2,N+1):
        if k*k>N:
            break
        if v[k]:
            m=2*k
            while m<=N:
                v[m]=False
                m=m+k
    return [k for k in range(N+1) if v[k] and k>1]

s=sieve(100_000_000)

from math import log
x=[k for k in range(1000,len(s),1000)]
y=[(s[k]/(k*log(k))-1-(log(log(k))-1)/log(k))*log(k)**2 for k in
     range(1000,len(s),1000)]

import matplotlib as mpl
import matplotlib.pyplot as plt
fig, ax = plt.subplots(figsize=(8,8))
ax.plot(x,y)
This code computes the primes up to 100 million and plots the actual size of the k-th prime, divided by a known asymptotic for the size of the k-th prime.
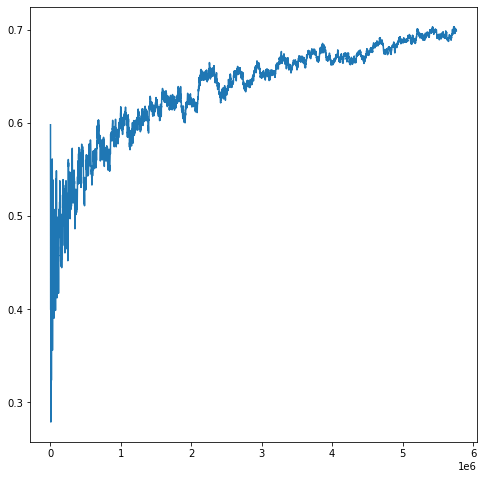
We only use Python to do the sieve. For the plot, we use Euler Math Toolbox.
>function python sieve (N) ...
$v = [True for _ in range(N+1)]
$for k in range(2,N+1):
$    if k*k>N:
$         break
$    if v[k]:
$         m=2*k
$         while m<=N:
$             v[m]=False
$             m=m+k
$return [k for k in range(N+1) if v[k] and k>1]
$endfunction
>tic; s = sieve(100 000 000); toc;
 Used 29.407 seconds
>n = length(s)
 5761455
>k = 1000:1000:n;
>y = (s[k]/(k*log(k))-1-(log(log(k))-1)/log(k))*log(k)^2;
>plot2d(k,y):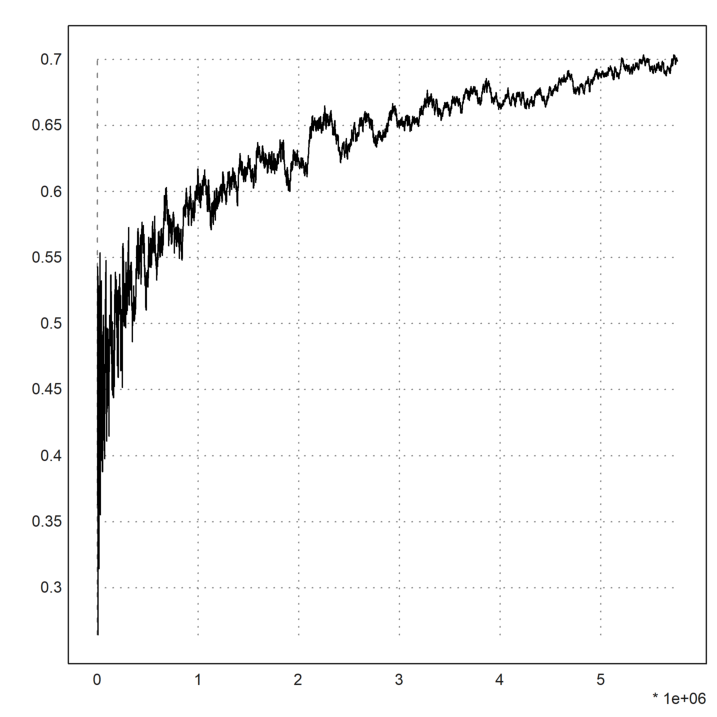
As you see, the sieve takes about 30 seconds on my computer (Core I7, 4.0GHz). Of course, it is much faster to do that in C.
>function tinyc csieve (N) ...
$ARG_DOUBLE(N);
$int n=(int)N;
$CHECK(n>10,"Need a positive integer.");
$char *v = (char *)getram((n+1)*sizeof(char));
$CHECK(v,"Out of heap space.");
$
$for (int i=0; i<n+1; i++) v[i]=1;
$for (int k=2; k<n+1; k++)
${
$   if (k*k>n) break;
$   if (v[k])
$   {
$       int m=2*k;
$       while (m<=n)
$       {
$           v[m]=0; m+=k;
$       }
$   }
$}
$int count=0;
$for (int k=2; k<n+1; k++) count+=v[k];
$
$header *out=new_matrix(1,count);
$CHECK(out,"Out of heap space");
$double *res=matrixof(out);
$
$int j=0;
$for (int k=2; k<n+1; k++)
$   if (v[k])
$       res[j++]=k;
$
$moveresults(out);
$endfunction
>s=csieve(100)
 [2,  3,  5,  7,  11,  13,  17,  19,  23,  29,  31,  37,  41,  43,  47,
 53,  59,  61,  67,  71,  73,  79,  83,  89,  97]
>tic; s=csieve(100 000 000); toc;
 Used 1.459 seconds
The procedures to communicate from EMT to Tiny C are a bit involved. But the result is 15 times faster. The basic code is a direct translation of the Python code.
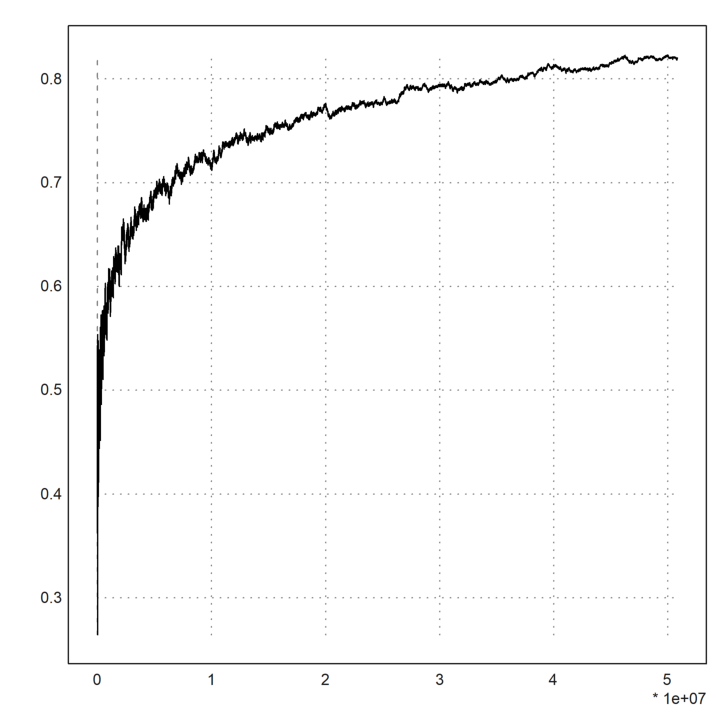
Depending on your heap space of Euler Math Toolbox, you can do more primes. If you compress the sieve using bits, you could to a lot more. But for this code and the default size, 100 million is the limit. Increasing the stack size to 2048 MB, I could do all primes up to 1 billion in 15 seconds.
Published .